CouchDB2.0 Monitoring
CouchDB2.0 server is an open source, document-oriented NoSQL database that supports massive data storage and management with increased flexibility and scalability as compared to traditional databases. It provides The performance of databases defines the success of organizations in providing the 24x7 level of customer satisfaction and smooth operations of day to day business activities. CouchDB2.0 Database Monitor helps you to monitor the performance of database and provide extensive information so that necessary steps can be taken before a breakdown of vital business processes occurs.
Monitored Attributes
| Name | Units | Description |
|---|---|---|
| couchdb.by_db.disk_size | bytes | Disk size per database |
| couchdb.by_db.doc_count | documents | Document count per database |
| couchdb.couchdb.auth_cache_hits | hits | Number of authentication cache hits |
| couchdb.couchdb.auth_cache_misses | misses | Number of authentication cache misses |
| couchdb.couchdb.database_reads | reads | Number of times a document was read from a database |
| couchdb.couchdb.database_writes | writes | Number of times a document was changed |
| couchdb.couchdb.open_databases | items | Number of open databases |
| couchdb.couchdb.open_os_files | files | Number of file descriptors CouchDB has open |
| couchdb.couchdb.request_time | seconds | Length of a request inside CouchDB without MochiWeb |
| couchdb.httpd.bulk_requests | requests | Number of bulk requests |
| couchdb.httpd.clients_requesting_changes | connections | Number of clients requesting a change |
| couchdb.httpd.requests | requests | Number of HTTP requests |
| couchdb.httpd.view_reads | reads | Number of view reads |
| couchdb.httpd_request_methods.DELETE | requests | Number of HTTP DELETE requests |
| couchdb.httpd_request_methods.GET | requests | Number of HTTP GET requests |
| couchdb.httpd_request_methods.HEAD | requests | Number of HTTP HEAD requests |
| couchdb.httpd_request_methods.POST | requests | Number of HTTP POST requests |
| couchdb.httpd_request_methods.PUT | requests | Number of HTTP PUT requests |
| couchdb.httpd_status_codes.200 | requests | Number of HTTP 200 OK responses |
| couchdb.httpd_status_codes.201 | requests | Number of HTTP 201 Created responses |
| couchdb.httpd_status_codes.202 | requests | Number of HTTP 202 Accepted responses |
| couchdb.httpd_status_codes.301 | requests | Number of HTTP 301 Moved Permanently responses |
| couchdb.httpd_status_codes.304 | requests | Number of HTTP 304 Not Modified responses |
| couchdb.httpd_status_codes.400 | requests | Number of HTTP 400 Bad Request responses |
| couchdb.httpd_status_codes.401 | requests | Number of HTTP 401 Unauthorized responses |
| couchdb.httpd_status_codes.403 | requests | Number of HTTP 403 Forbidden responses |
| couchdb.httpd_status_codes.404 | requests | Number of HTTP 404 Not Found responses |
| couchdb.httpd_status_codes.405 | requests | Number of HTTP 405 Method Not Allowed responses |
| couchdb.httpd_status_codes.409 | requests | Number of HTTP 409 Conflict responses |
| couchdb.httpd_status_codes.412 | requests | Number of HTTP 412 Precondition Failed responses |
| couchdb.httpd_status_codes.500 | requests | Number of HTTP 500 Internal Server Error responses |
Configuring AppPerfect Agentless Monitor to monitor CouchDB2.0 Server
Following steps will explain how you can configure AppPerfect for Monitoring CouchDB2.0 Database Resources:
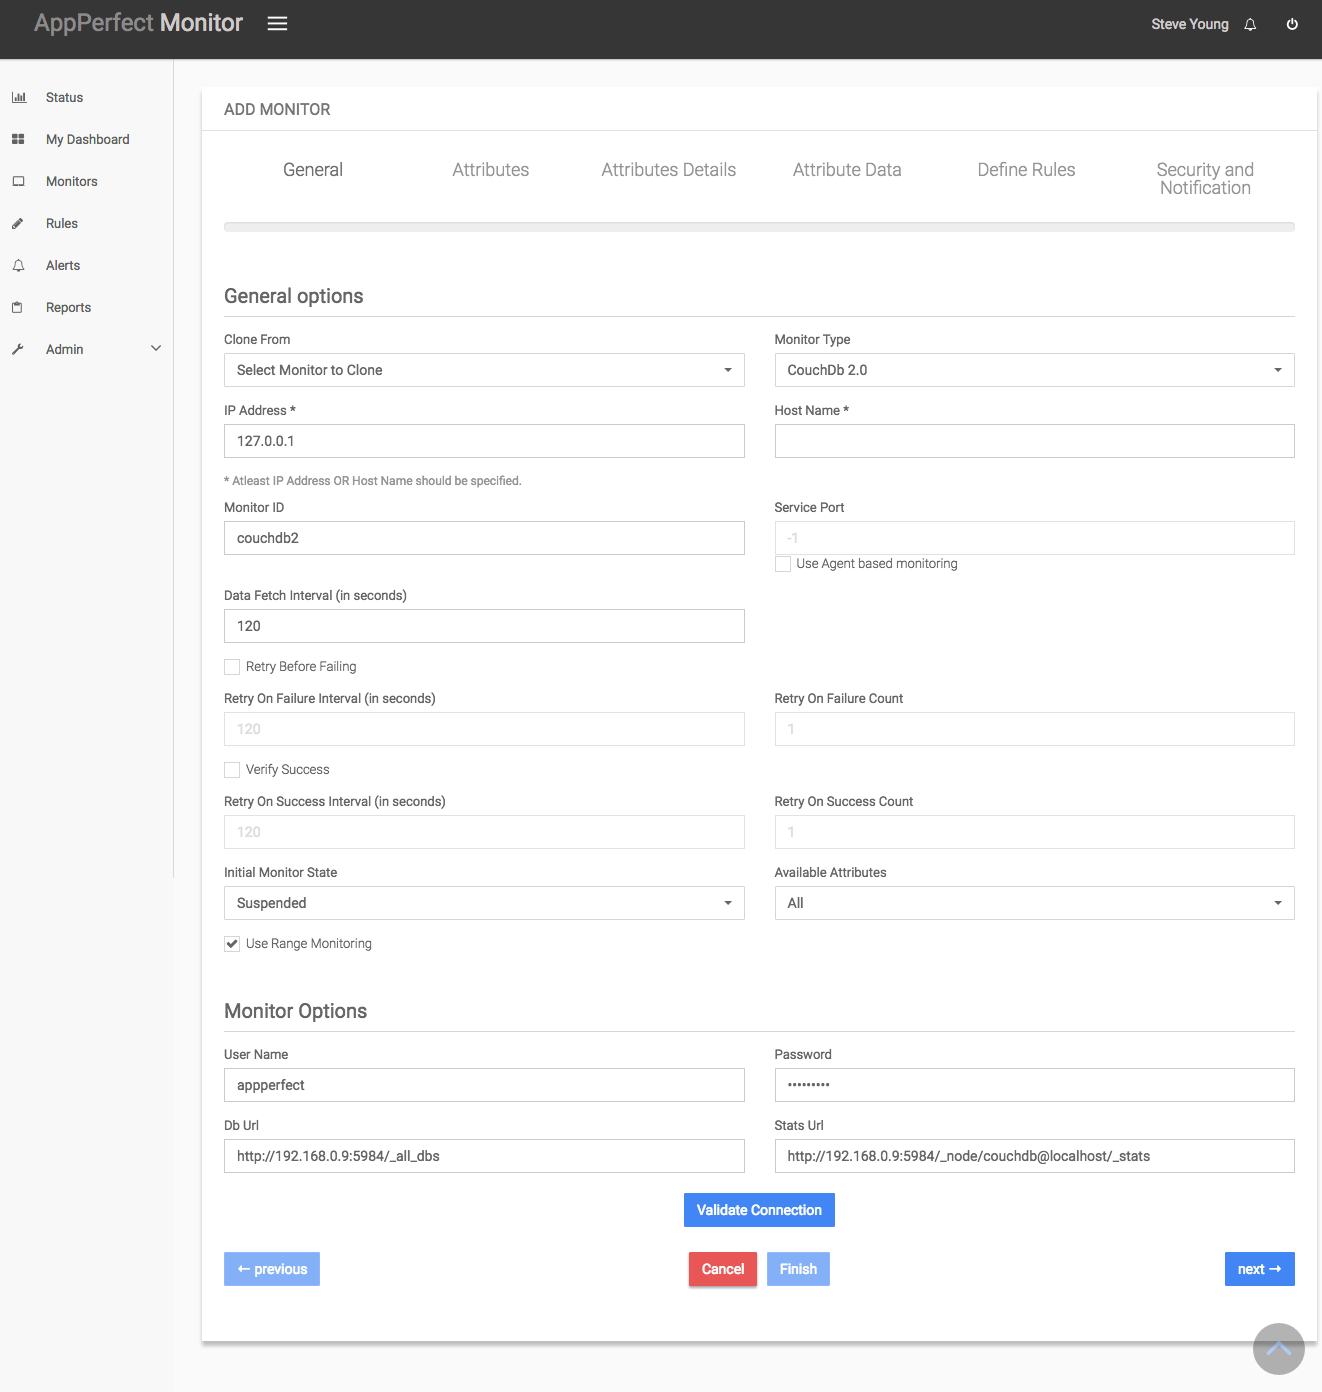
- Once you are logged into the Monitor Server you can see the Web-UI from which you can access all the features of the Monitor Server. Click the Monitors link from the top navigation bar. This will take you to Monitors tab. Click on Add button to Add a New NoSQL Monitor.
- Next Step is to define the NoSQL Monitor. Provide the IP Address or Host Name of the target database server which needs to be monitored.
- Select the NoSQL Monitor Type from the drop down. AppPerfect can monitor NoSQL databases such as CouchDB2.0, CouchDB, MongoDB, Cassandra, Couchbase for performance and robustness. Select the monitor type which suits your requirement.
- Specify a meaningful identifier for the monitor which will help identify the monitor in future.
- Specify the Data Fetch Interval which represents the time interval for which application should wait before fetching the monitoring data from the device. Monitoring Data will be fetched after every specified fetch interval. The smaller the time interval, the more granular the data. However, smaller time intervals also result in a much larger data set.
- You can specify if the monitor should be Active as soon as its added or should it be in suspended state.
- Next Option is to provide database specific configuration settings. Provide username, password, stats URL and db URL to connect to your server. A sample Stats URL might look as follows: http://192.168.0.9:5984/_node/couchdb@localhost/_stats. A sample db URL might look as follows: http://192.168.0.9:5984/_all_dbs. Once you are done providing the database settings, click on Validate Connection button to confirm that CouchDB2.0 database is accessible.

- Next Step is to Select the Attributes to monitor. Database Monitoring allows you to monitor crucial parameters such as Memory consumption, Connections information, CPU utilization rate, Disk fetches etc. Select the parameters you need to monitor from the list of attributes shown.

- Next step shows the Attribute details of all the selected attributes in the previous step. You can customize the display labels for each of the attributes here.

- Next step shows the Attribute Data conversion where you can convert the attribute value to required unit. You can configure the operation which should be performed on the attribute value to create the final output value.

- Next step shows the Defining Rules view. This view will provide a list of all numeric attributes. You can select the attributes for which you want to add a rule. A rule is defined as a conditional or threshold value which when exceeds, a notification would be sent. In a typical workflow the monitors extract data from the monitored device and send it to the rules engine. The rules engine evaluates the data to ensure no rule is violated and then sends it to the view manager. However, if a rule is violated, a message is immediately sent to the notification server to alert the user about the rule violation.Rules can be defined at a later stage as well. For details on how you can add/edit rules for the monitor, please see the Rules chapter.
- Next step shows the Security & Notification settings. When a rule is violated a notification is sent out to all the concerned users that a particular event has occurred and needs to be dealt with. This process is called notification. AppPerfect provides five modes of notification. They are Email notification, SMS notification, Custom notification, Log notification, Database notification, SNMP Trap notification. For details on each of the supported notification , please see the Notification chapter. In this view you can configure the type of notification which should be sent on Rule violation, Users/Groups to whom notification should be sent and also the subject and details on the notification message.
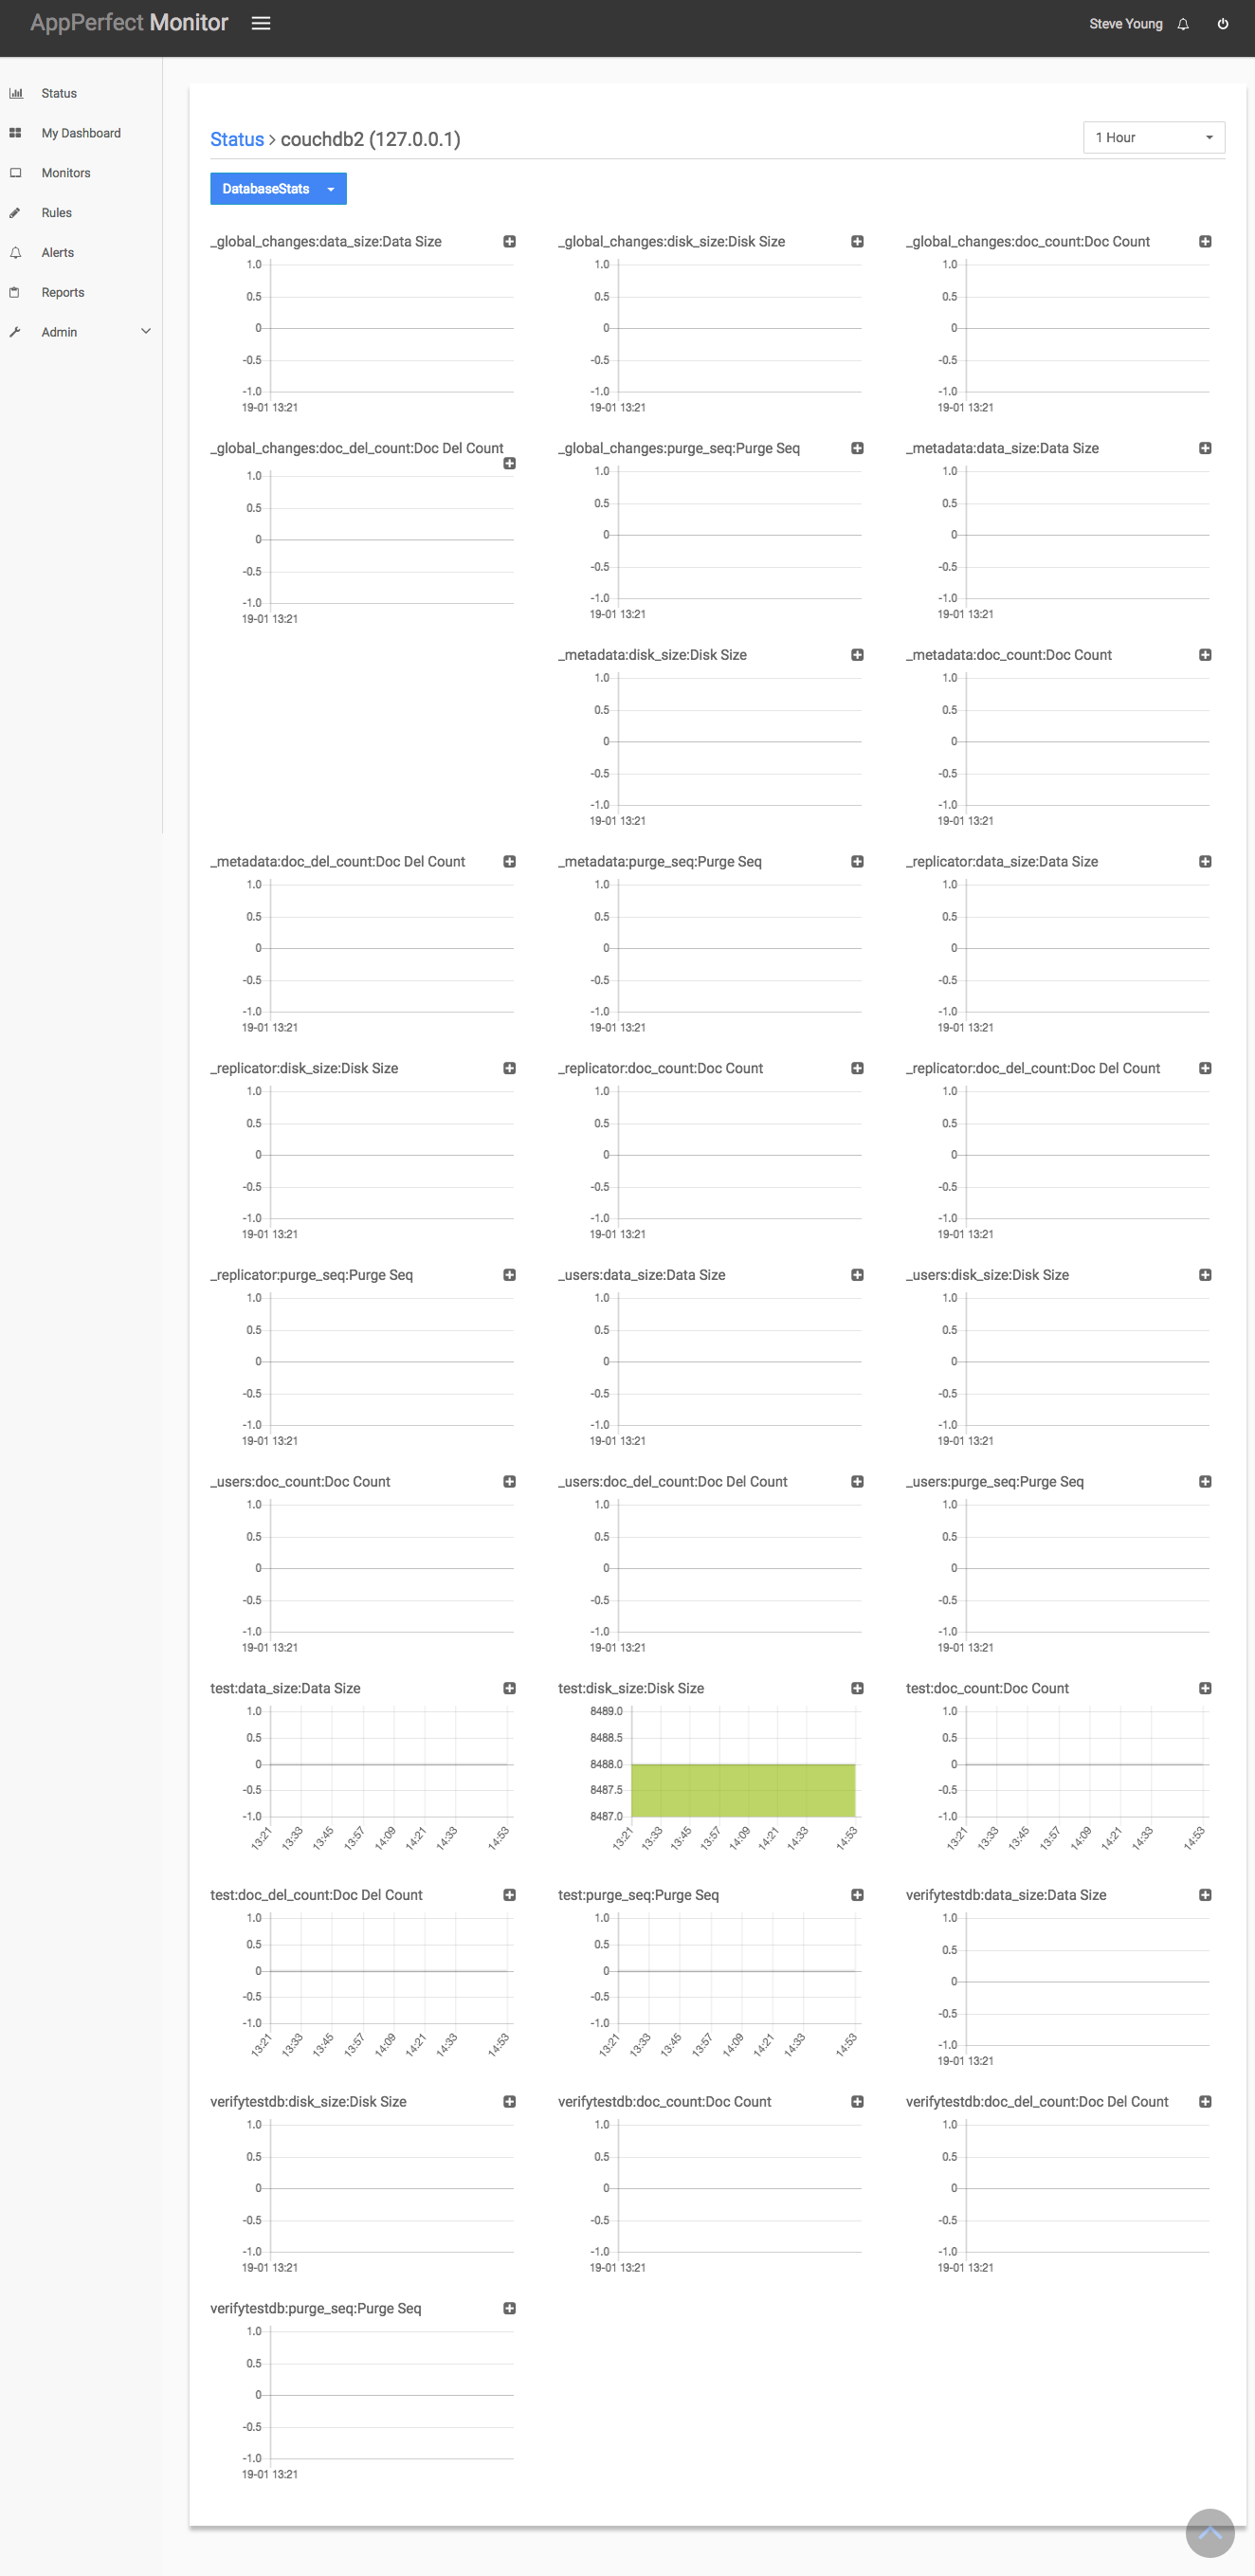
- Click on finish button. We are done adding the monitor for CouchDB2.0 Database Monitoring. Once Database Monitor is added, you will get a message Database Monitor added successfully. Now go to Status. Expand the data for IP provided in IP Address while creating the monitor. Expand CouchDB2.0 Monitor. Click on + icon against the charts that you want to monitor in your Dashboard.

We use cookies for analytics, advertising and to improve our site.
By continuing to use our site, you accept to our Privacy policy
and allow us to store cookies.